


Heard the one about West Antarctic cooling from BP shill Toby Young?
Cool off Toby!


The paper highlights data from ONE station (the first graph), in the central area, the Mary Bryd station. It is not an average of the whole of West Antartica in which, as you can see from the circles above many areas, including the Thwaites and Pine Island Glaciers, are significantly warming. Only the Spring cooling of 1.8 degrees at Mary Bryd shows statistical significance. The cooling is due to changes in winds coming from the Pacific. It only shows cooling for TWO subsequent decades. Fluctuations always occur in single areas as well as in global yearly anomalies; that is why global averages are taken and longterm trends observed.
As we know the oceans are full of heat and and are melting the ice sheets from underneath.
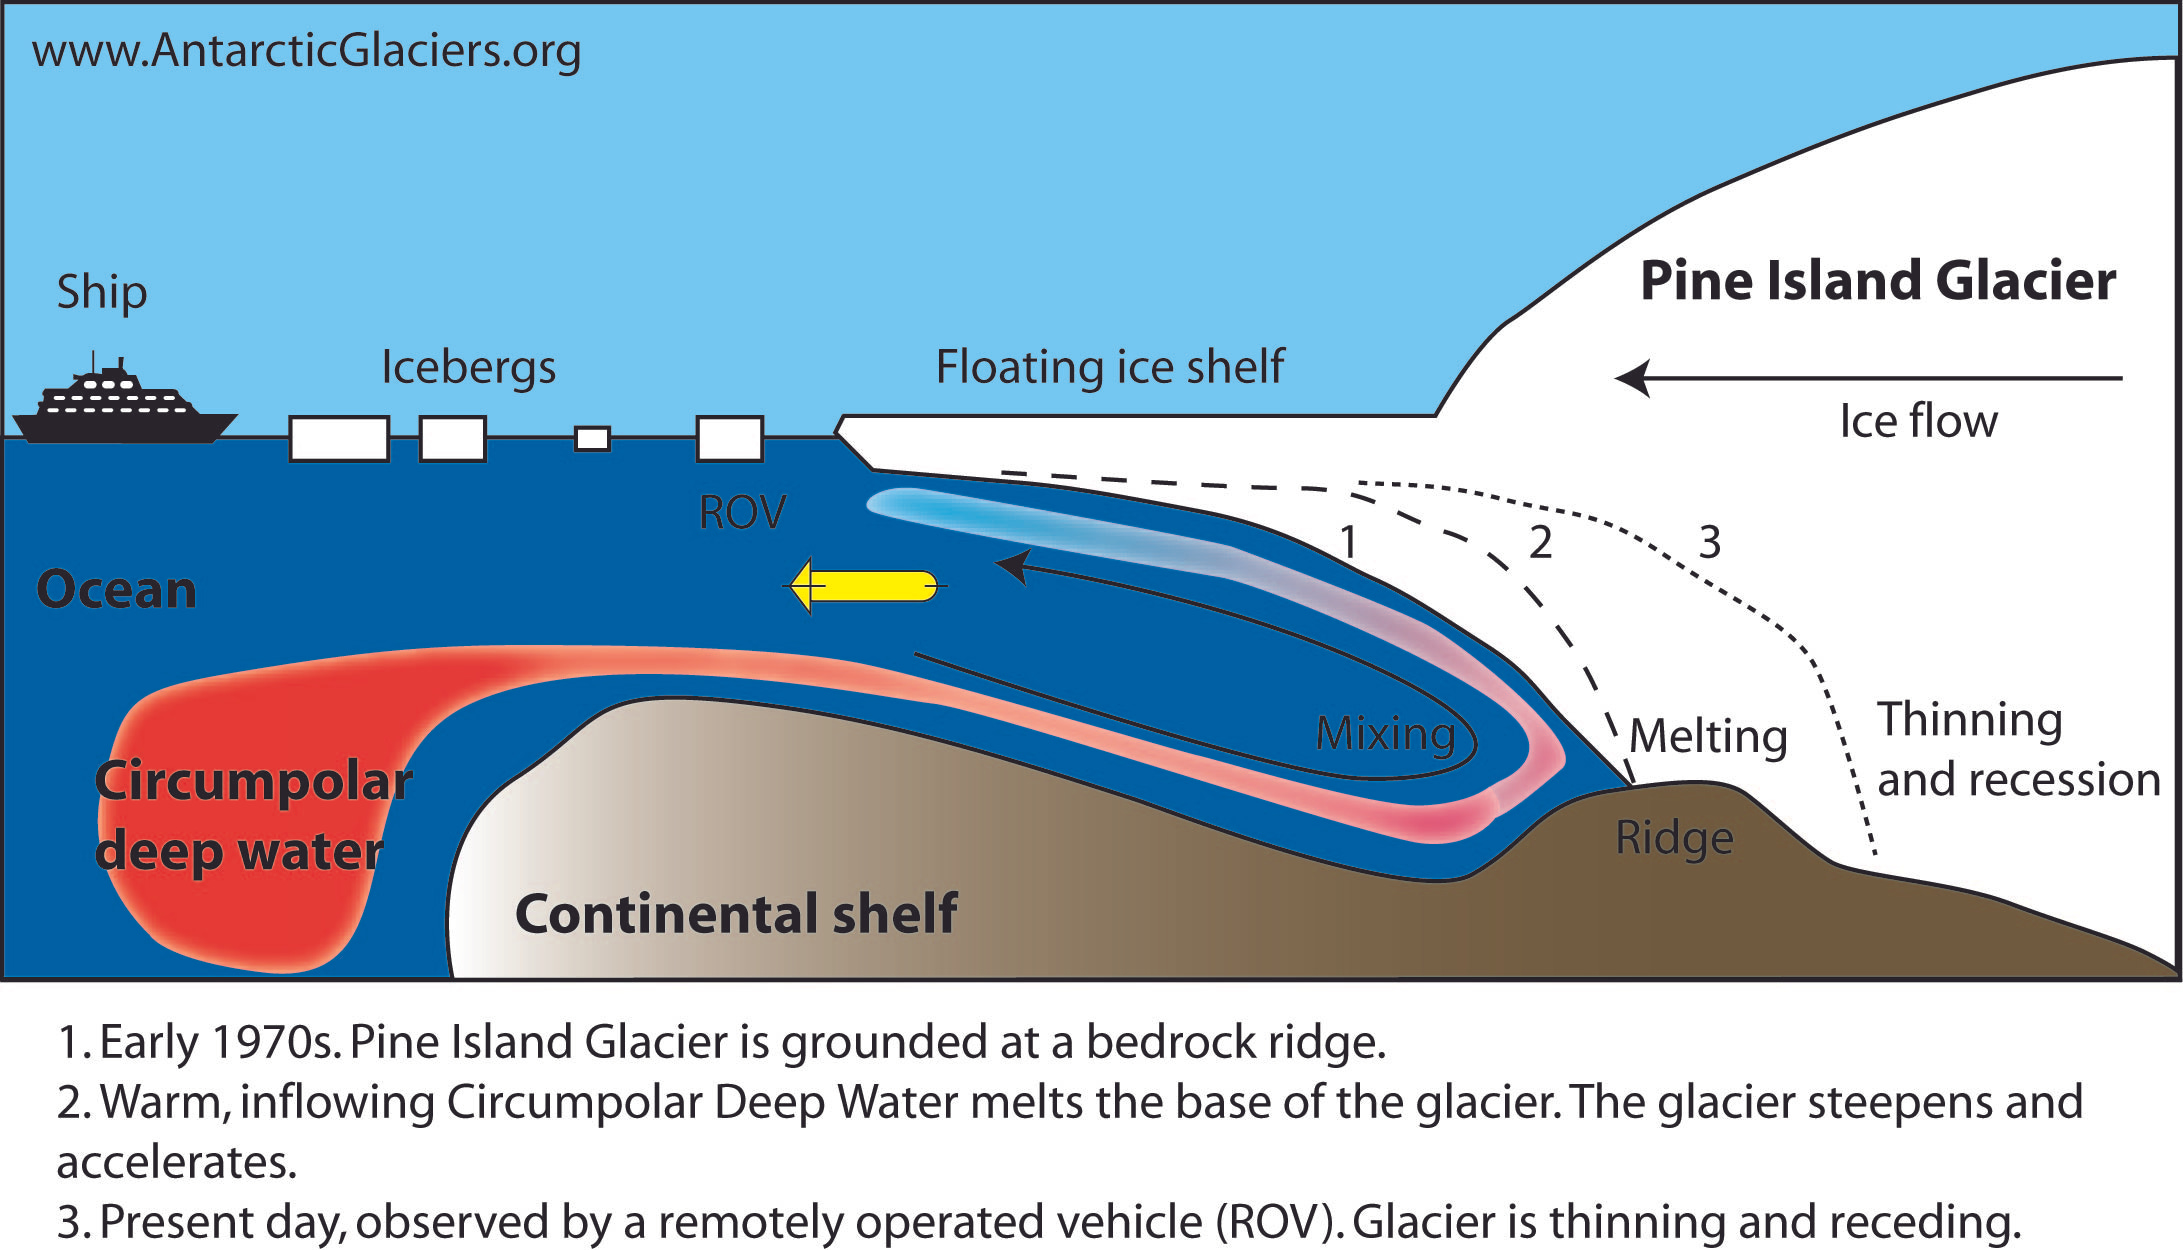
Thwaites (the Doomsday) glacier and Pine Island, though small, already contribute 5% to sea level rise. In the 21st Century the ocean temperatures will triple compared to the rise in temperature in the 20th.
Some realism is required; not being mislead by fossil fuel funded talking heads.
🐒
More evidence on Toby’s funding for his climate denial blog and net-zero watch; caught on camera admitting it comes from BP
My wife, who works for NOAA just sent me an article they put out about the super La Nina we just experienced in 2021-2023. We are still learning the complexities of ocean temperatures and wind currents related to it and how it affects our climate. The oceans are holding much of the heat we are creating with greenhouse gases. The Antarctic is a strong indication of what's happening UNDER the surface. https://research.noaa.gov/2023/11/07/recent-triple-dip-la-nina-upends-current-understanding-of-enso/