


No evidence of 'turbo cancers'
nor of depopulation

Depopulation
A run down of year, Deaths in England and Wales, Death Rate compared to population (not age adjusted)
2019 530, 841 (0.89%)
2020 608,002 (1.02%)
2021 586,334 (0.98%)
2022 576, 334 (0.96%)
2023 580, 073 (0.95%)
For comparison there were 17,700, 6%, more deaths in 2008 (population 54, 841, 000 deaths 509,000= 0.92%) than in the following year of 2009 (population 56,235, 000 491,358 = 0.873%). The number of deaths fell by 17,700, from one year to the next, even though the population was increasing and there was a financial crisis. These things happen and attribution is difficult.
The death rate in 2022 was 0.96%, the population was 60,238,038. Estimating the population for 2023 (with 605,479 births as in 2022) to 60,843517 makes a death rate of 0.95%.
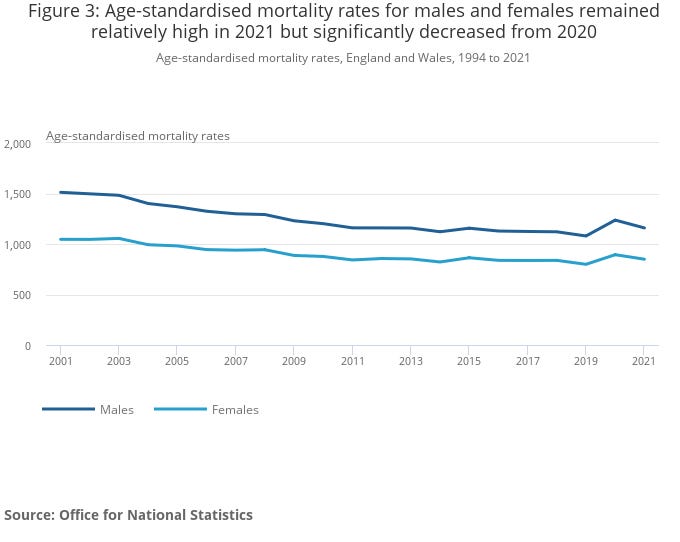
The death rate is decreasing from 2020 and in 2023 was lower than in 2020, 21 and 22 so is also lower than in the years 2000 to 2011 before the death rate dropped to unprecedentedly low levels in 2019.
When age adjusted the death rates for 2022 and 2023 will be even lower because the population of England and Wales is ageing.
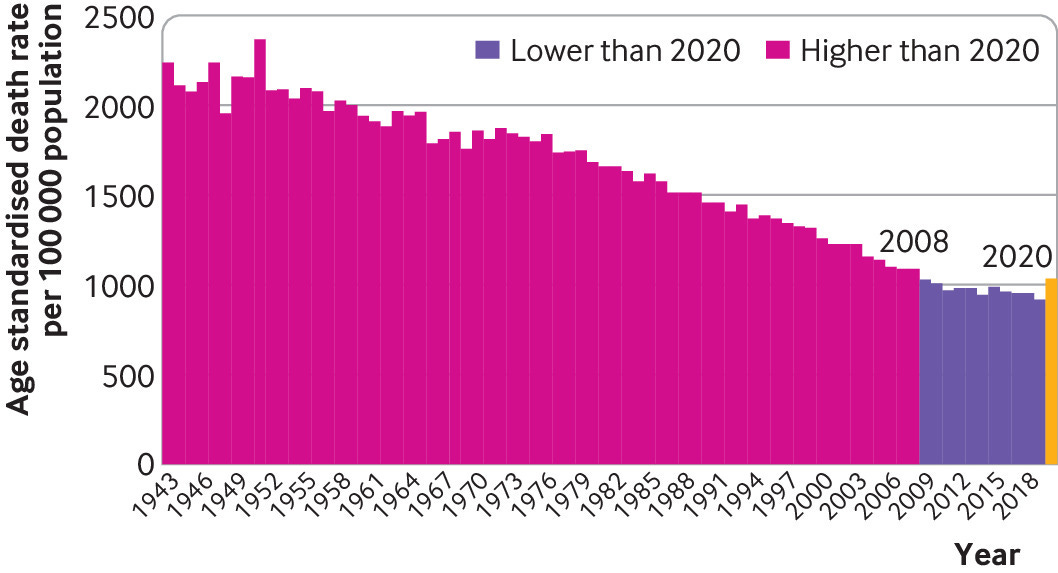
The death rate in 2023 is also lower than every year between 1943 and 2008
The stats from the ONS on vaccination status in 2023 for all age groups show all cause mortality of greater in the unvaccinated than in vaccinated in many months including ;
Jan 2023 unvaccinated is 1437deaths /100,000 person years vs 4 doses 1159 deaths/100,000. Feb is 1260 unvaccinated vs 1015 for 4 doses. March is 1168 unvaccinated vs 1035 for 4 doses. April 1106 unvaccinated vs 947 for 4 doses.
However, apparent improvements in mortality from the jabs are confounded by the vaccinated being counted as unvaccinated for 14 days after jabs. They are also confounded by survivorship bias, those surviving to the 4th dose will naturally be from a small group; it should include those who have died from earlier doses. They are also confounded by case counting (from day of vaccination) bias, age and seasonality bias, all of which do not occur with placebo controlled studies. For a brilliant explanation of how a completely ineffective, hypothetical vaccine can be made to look effective eg 48% to 67% effective, please see this paper ‘Sources of bias in observational studies of covid-19 vaccine effectiveness’ from Peter Doshi
For 18-39 years olds excluding ‘covid’ showed apparent increases in vaccinated deaths.
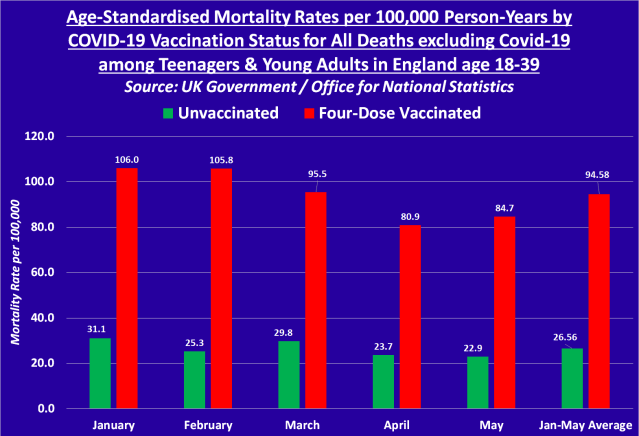
However, this is not a randomised trial. It does not show increased risk of dying from vaccination. The groups are self-selected. The younger people getting vaccinated, particularly 4 doses, are more likely to be asthmatic, obese, have health conditions making vaccination strongly encouraged and/or are already on harmful medications to start with. The unvaccinated are far more likely to be health conscious and not on medication.
For all cause 40-49
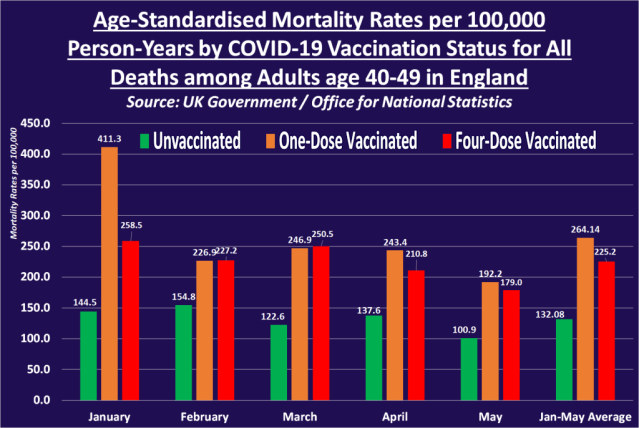
The same confounding factors apply as for 18-39 year olds. The one-dose figure for January 2023 of 411 number stands out. It represents deaths in people having had only one dose at least 21 days ago and accounts for 36 deaths in a cohort of about 9000 person years.
The 9000 are the 40-49 year olds who register as having had one dose at anytime in the past 3 years. It does not represent a large number of people suddenly. dying immediately after getting a shot. In many other months and age groups, that are not shown by the authors, single dose deaths are lower than unvaccinated deaths. There many also be issues with underestimating the numbers of people who are unvaccinated, and therefore the number of deaths that he vaccinated are being compared to, will be lower.
Observation studies are so fraught with complications that either side, trying to show vaccine effectiveness or vaccine harm, can show just about anything.
Vaccines are harmful. Don’t have them. However it is not a genocide. The populations of the UK and USA are still increasing.
‘Turbo cancers’.
Mike Donio writes about the excitement over the 200% increase in pancreatic cancer (associated with insulin insensitivity, obesity and saturated animal fat consumption) in young girls; but this was in 2018; so before the jabs.
As regards ‘turbo’ cancers especially in the young; when looking at the data from this original paper we see that the deaths are presented for each individual cancer; breast, skin, colon, pancreas and brain and that deaths in 2022 are similar, lower or very slightly higher than previous years between 2010 and 2021. For example for breast; looking at the circles, nothing to see here at all.
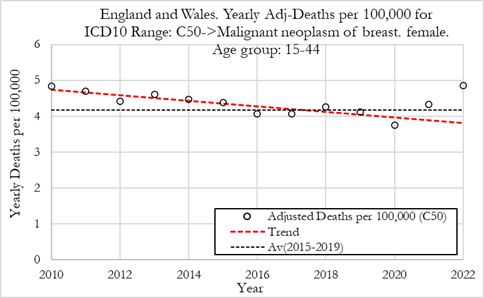
Though perhaps you spotted the red line or ‘trend’ which I certainly wouldn’t have drawn from this scant amount of data, making the same number of deaths (a less than 1 death per 100,000 difference), dipping slightly between 2010 and 2022, though rising again, into a downward trend.
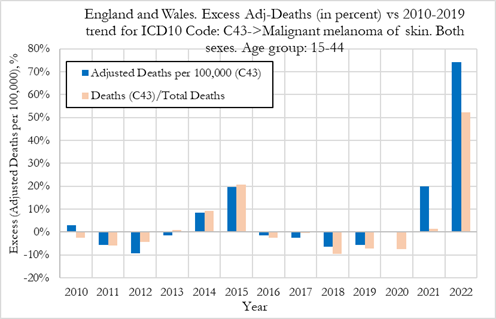
Using the 2022 deaths compared to this false downward trend the authors of a sensationalised review by Edward Dowd misrepresent them as this;
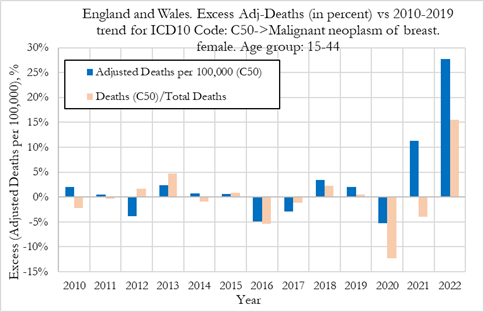
The largest increase compared to 2021 (the next highest year) was 0.4 deaths/100,000 for colon cancer in 15-44 year olds, so 60 more deaths from colon cancer in about 15 million people in 2022 than 2021.
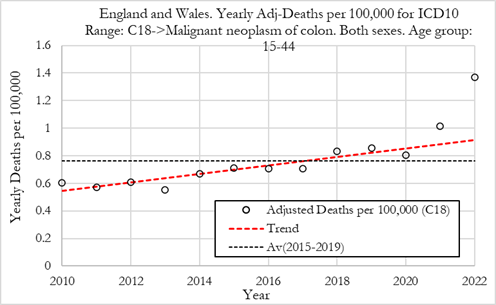
It is not an explosion as the data set is too small to draw this conclusion; but continues the worrying increase in colon cancer in young people (18-39) since 1990 and even more so from 2010.
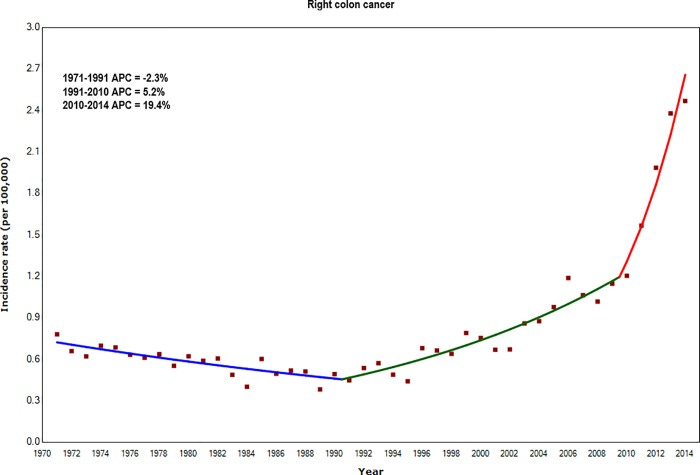
Colon cancer deaths in 20 to 54 year olds (a slightly older age group) have also been on an upward trend since the mid 1990s shown in this paper from 2017, though they are still lower than in the 1970s when there were over 6 deaths/100,000 compared to the slightly younger age group above of 1.4 deaths/100,000. A larger data set also shows variance, up of down, of about 0.4 deaths/100,000 (aka the explosion above) have often occurred before.
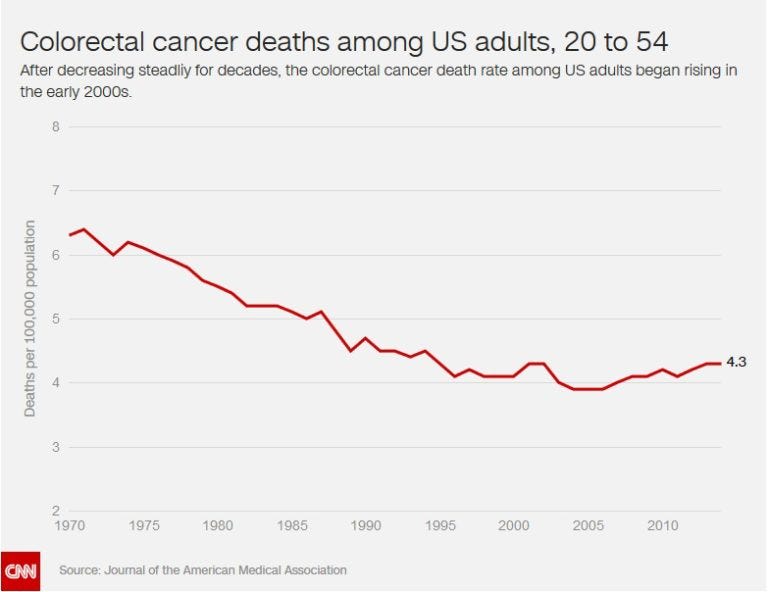
This may be due to all sorts of factors; lack of exercise, junk food and increasing obesity. It could also be due to increased screening and lethal treatment. The incidence of colorectal cancer in 20-39 year olds in England has been steadily increasing since 1990 and rose significantly in 2010 onwards and colon cancer deaths in 20-54 year olds in the US have been significantly increasing since at least the mid 1990s; well before the jabs.
The graphs presented only show 10 years, which is not long enough to see definite trends nor to draw a line of best fit, which they've done, there are not enough data points. This sensationalised article claims that 2022 bucked the downward skin cancer trend, which is not justified from this amount of data; skin cancer deaths were going up and down. A tiny increase of 15 more deaths in 2022 than 2020 may be due to people not getting their moles checked during lockdown? However there were 30 more deaths from skin cancer in 2015 than in 2022
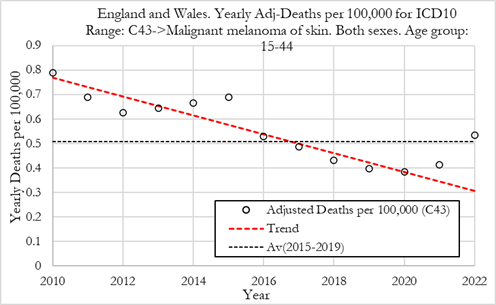
The trend in skin cancer deaths is clearly not down. This is false. Since the early 1970s, melanoma skin cancer mortality rates have increased by around two-and-a-half times (141%) in the UK. Yet they misrepresent 2022 compared to a false trend in the graph above as this sensationalised nonsense in the graph below.
There is no evidence that the jabs have caused turbo cancers nor are they depopulating us.
🐒
.
https://vigilantnews.com/post/new-report-young-people-dying-of-cancer-at-explosive-rates-uk-government-data-show
What do you think of the many reports like this WRT the overall death rates?
Jo, It might be a build of a range of factors, might be related to COVID (whaver it is) or might be the vaccine itself. There were a lot of 'odd deaths' as a result of COVID (possibly exacerbated by the results of lockdowns ... isolation, stress caused illness, etc) but VAERS in the US and DAENS in Australia show the same level of reporting post-'vaccine'. In both cases higher adverse reactions than the sum of all previous vaccines forever. Have you ever had an exchange with https://andrewmadry.substack.com/ ... it might be interesting if you are open to it. Cheers