


Deaths England and Wales 2019-2024
'Excess' death is relative; there is no standard number of deaths in a year!

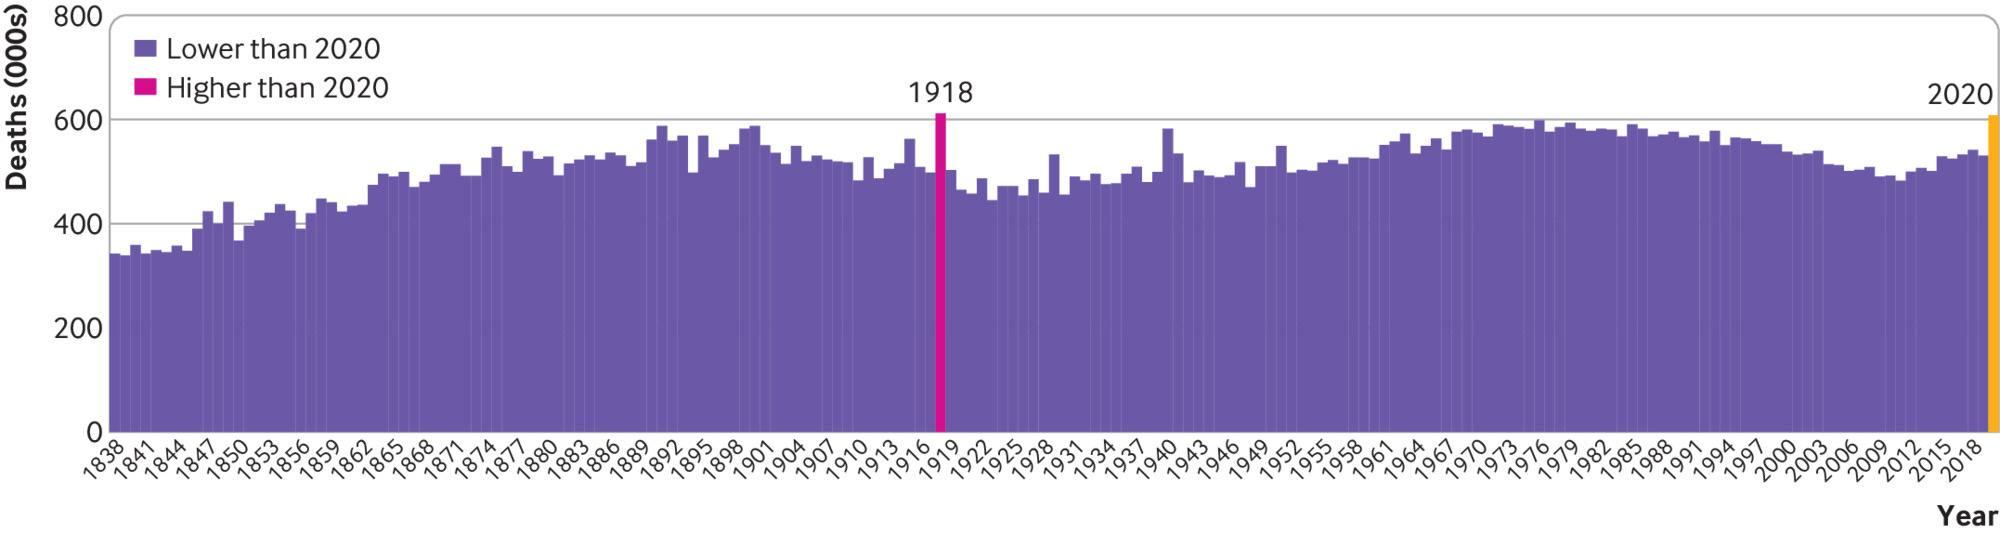
A crude comparison of deaths from 1838 to 2020 above. Looks scary. However, the numbers of the dead must always compared to the numbers of the living and how old they are. Here they are adjusted firstly for the increase in population.
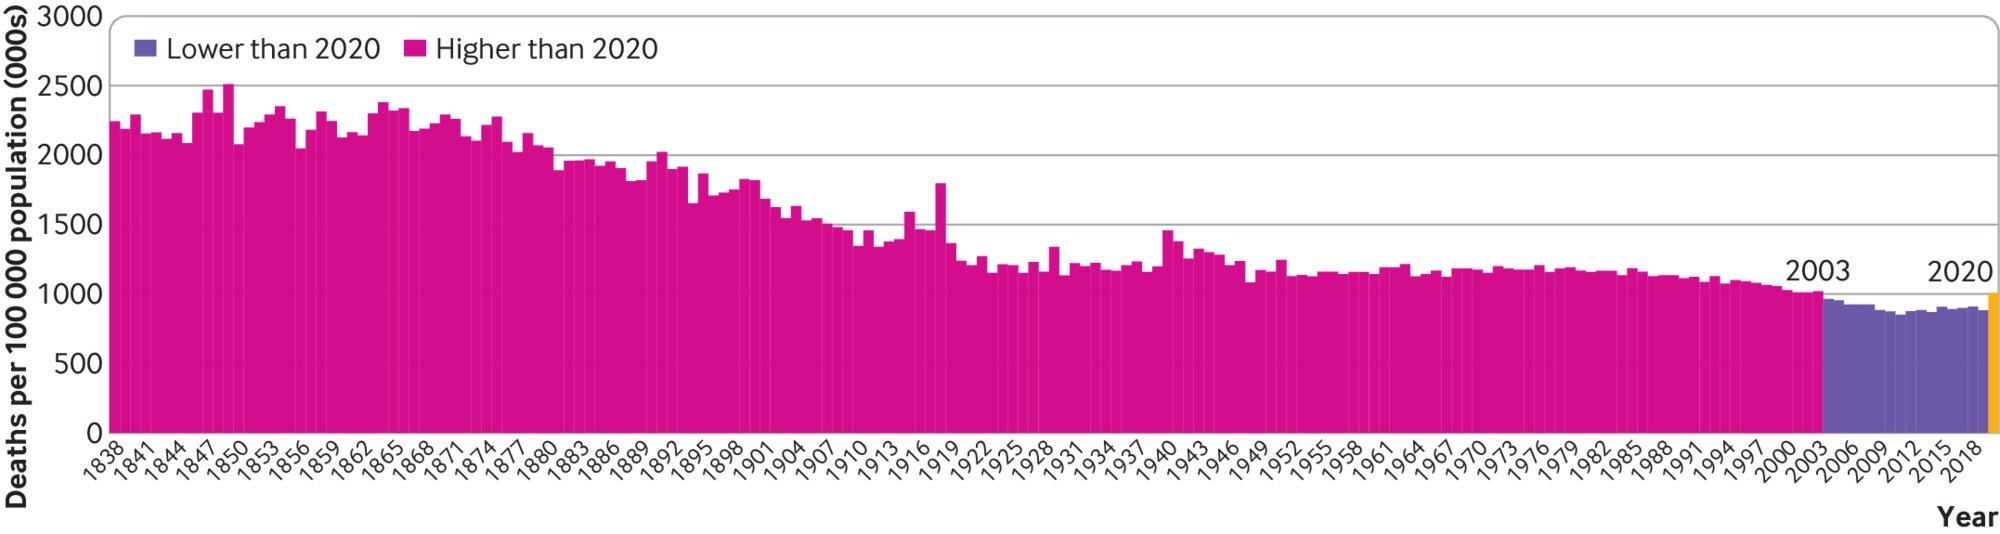
Here adjusted for both the increase in population and its increasing age (in an ageing population more people are likely to die, this is adjusted for by reference to a standard profile):
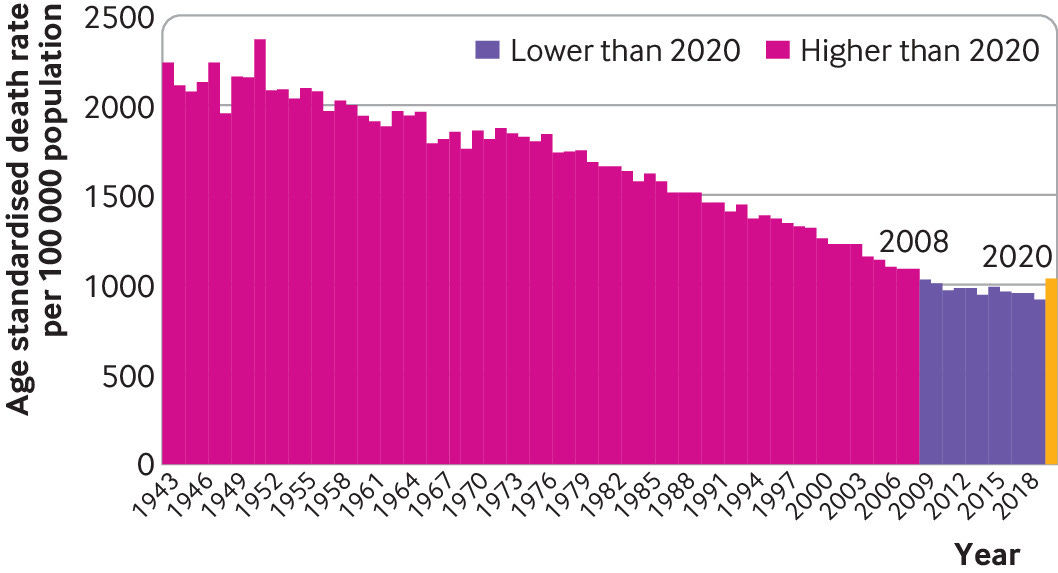
Graphs taken from UK deaths in 2020: how do they compare with previous years?
Increase in deaths in 2020, with median age 83, from low deaths in the previous 5 years, are explained by the loneliness of lockdowns and murder by midazolam
From the ONS;
2019
There were 530,841 deaths in an increasingly ageing population of 59,500,000 (0.892%)
2020
There were 608 002 deaths (aka care home murders) out of 59,719,724 (mid 2020) people (1.02%).
An increase of 0.128% (unadjusted for age) from 2019
2021
There were 586,334 deaths out of 59,641,800 people (0.98%)
A drop of 0.04% (unadjusted for age) from 2020 to 2021.
2022
There were 576,896 deaths (recorded up to week ending December 30th) out of 59,740,138 people (estimated end of year) (0.96%).
A drop of 0.02% (unadjusted for age) from 2021 to 2022.
580, 073 (0.95%)
A drop of 0.01% (unadjusted for age) from 2022 to 2023.
The death rate decreased in 2021 and decreased again in 2022. It was still higher in 2022 than in 2019, but not as high as 2020, nor 2008 nor any of the years before that.
‘Excess' death is relative; there is no standard number of deaths in a year!
I hope you can see the if you chose to compare 2022 with the average over 2005-2009, for example, instead of 2015-2019, then 2022 would show a whopping great decrease in excess deaths instead.
Update for 2024 up to Week 21; there were 243,045 deaths in England and Wales. The average number of deaths for the years 2018,19, 21, 22 and 23 aka the ‘expected’ deaths was 259,892. There have been 16,847 less deaths so far in 2024.
I’m not denying vaccine deaths of young fit people and children nor the possible future fertility issues but when looking at their effect on deaths it’s important to remember that the deaths in 2021, 2022 and 2023 were lower than in 2020 (please refer again to age and population adjusted graph above)- so do not represent depopulation.
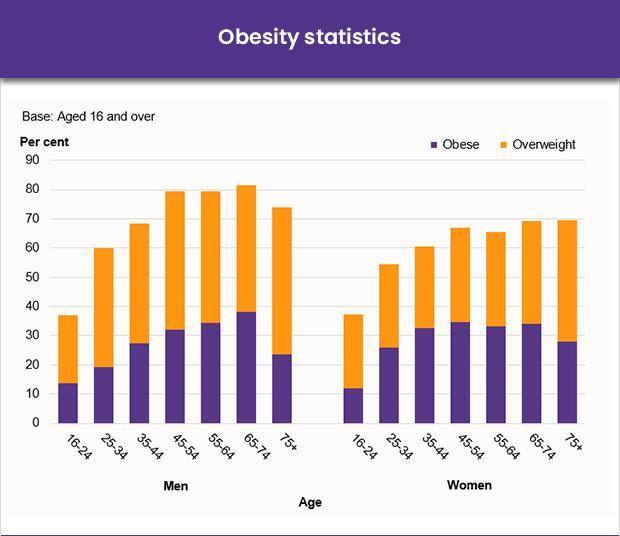
Obesity in the UK in 2022; 80% of men between 45 and 74 are overweight or obese:
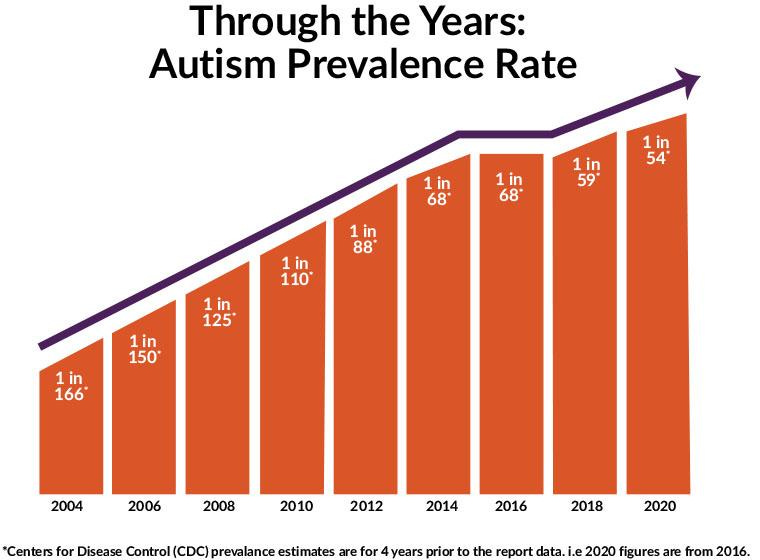
Autism in the US:
Myocarditis in France and Germany since 2017 and 2019:


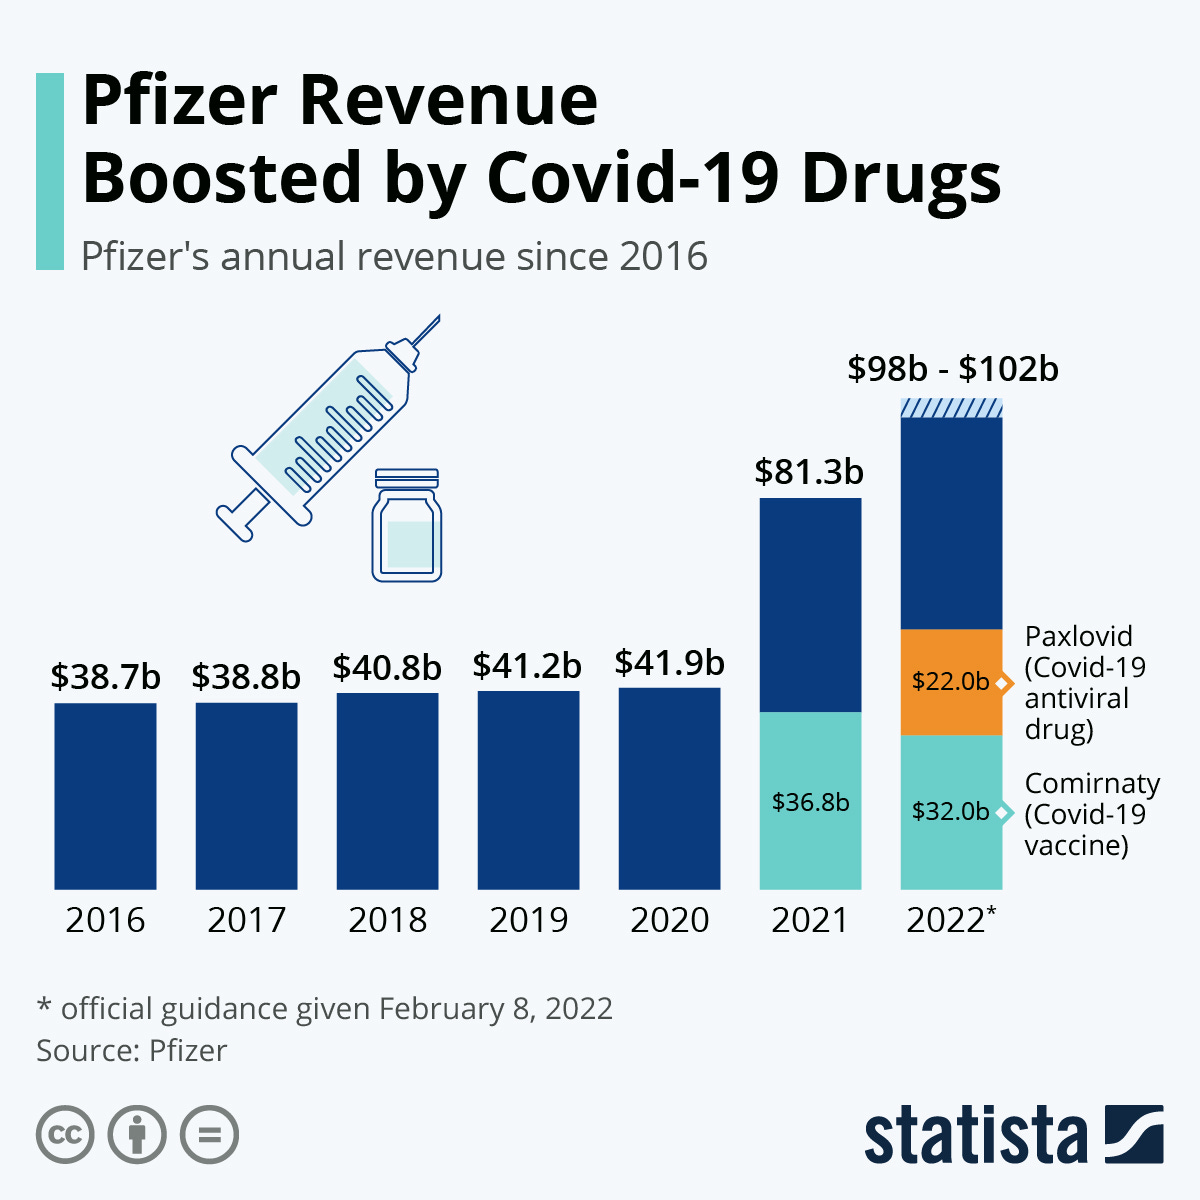
Profits of convicted criminals since 2016:
At the moment keeping us fat, sick, vaccinated and permanently on drugs from the age of two onwards is going much better than the depopulation.
This is not a genocide, it is income generation.
🐒
Happy Healthy, wild and free New Year 2023 one and all!
Jo
🐒
Hmmm...this makes me feel better than “it’s genocide”...so there’s that!:)
Can't the jump in 2020 be explained by the stress of the lockdowns, the deaths of the rest home people from purposeful bad medicine, and the killer policies inside the hospitals?